A) If more years of formal education are correlated with higher life expectancy, then the scatterplot would exhibit a positive slope.
B) If more years of formal education are not correlated with higher life expectancy, then the scatterplot would exhibit a flat slope.
C) If more years of formal education are not correlated with higher life expectancy, then the scatterplot would exhibit a flat or negative slope.
D) If more years of formal education are negatively correlated with higher life expectancy, then the scatterplot would exhibit a negative slope.
E) If other research shows a causal effect between years of formal education and higher life expectancy (additional years of formal education cause a higher life expectancy) , then the scatterplot could not be flat.
G) A) and B)
Correct Answer

verified
Correct Answer
verified
True/False
A graphical representation of a frequency distribution is called a pie chart.
B) False
Correct Answer

verified
Correct Answer
verified
Multiple Choice
Consider the relative frequency distribution given There were 60 numbers in the data set.How many numbers were in the interval 20-under 40?
A) 12
B) 20
C) 40
D) 10
E) 15
G) A) and E)
Correct Answer

verified
Correct Answer
verified
Multiple Choice
Consider the following frequency distribution: What is the midpoint of the last class interval?
A) 15
B) 350
C) 300
D) 200
E) 400
G) A) and D)
Correct Answer

verified
Correct Answer
verified
Multiple Choice
A shirt production company has tracked their production since the company started in 1999.The graph of their annual production is shown. 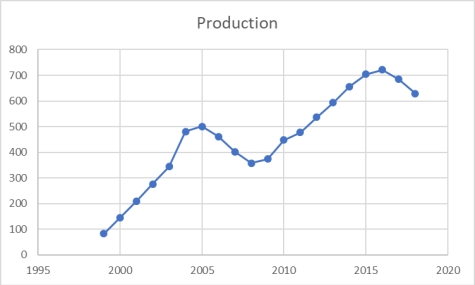 After 2005, in what year did production recover and surpass the production level of 2005?
A) 2006
B) 2009
C) 2010
D) 2012
E) 2013
G) D) and E)
Correct Answer

verified
Correct Answer
verified
Multiple Choice
The staff of Mr.Wayne Wertz, VP of Operations at Portland Peoples Bank, prepared a frequency histogram of waiting time for drive up ATM customers. 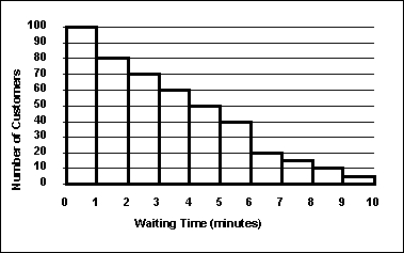 Approximately ____ drive up ATM customers waited at least 7 minutes.
A) 20
B) 30
C) 100
D) 180
E) 200
G) A) and D)
Correct Answer

verified
Correct Answer
verified
Multiple Choice
A shirt production company has tracked their sales of red and blue shirts over the past few years.The graph of both is shown below. 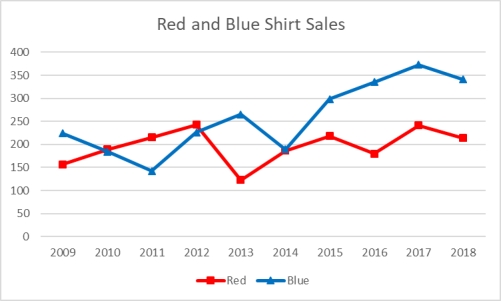 Which of the following is a true statement about the trends in sales?
A) Sales of red shirts are less than those of blue shirts in all the years before 2012.
B) Sales of blue shirts are trending upward from 2014 to 2017.
C) Sales of blue shirts are always higher than those of red shirts.
D) Red shirt sales show an increasing trend.
E) Sales of red shirts are always higher than those of blue shirts.
G) None of the above
Correct Answer

verified
Correct Answer
verified
Multiple Choice
Scott Brim, Chief Financial Officer of Space Mall, Inc., wants to better understand the busiest business hours during the weekend.There are door sensors that approximate the number of people who enter the mall.The table below presents the average number of people coming in during the weekend, for the last month each hour: The relative frequency of the fourth class interval is _________.
A) 0.07
B) 0.08
C) 0.14
D) 0.15
E) 0.38
G) A) and B)
Correct Answer

verified
Correct Answer
verified
Multiple Choice
The staff of Ms.Tamara Hill, VP of Technical Analysis at Blue Sky Brokerage, prepared a frequency histogram of market capitalization of the 937 corporations listed on the American Stock Exchange in January 2019. Enlarged chart below and same chart in question 65 is also made larger, per suggestion 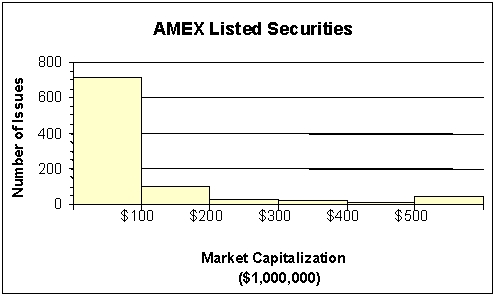 Approximately ________ corporations had capitalization exceeding $200,000,000.
A) 50
B) 100
C) 700
D) 800
E) 890
G) B) and C)
Correct Answer

verified
Correct Answer
verified
True/False
For any given data set, a frequency distribution with a larger number of classes will always be better than the one with a smaller number of classes.
B) False
Correct Answer

verified
Correct Answer
verified
Multiple Choice
The following class intervals for a frequency distribution were developed to provide information regarding the starting salaries for students graduating from a particular school: Before data were collected, someone questioned the validity of this arrangement.Which of the following represents a problem with this set of intervals?
A) There are too many intervals.
B) The class widths are too small.
C) The class widths are too large.
D) The second and the third interval overlap.
E) There are too few intervals.
G) D) and E)
Correct Answer

verified
Correct Answer
verified
Multiple Choice
Each day, the manager at Jamie's Auto Care Shop prepares a frequency distribution and a histogram of sales transactions by dollar value of the transactions.Friday's histogram follows. 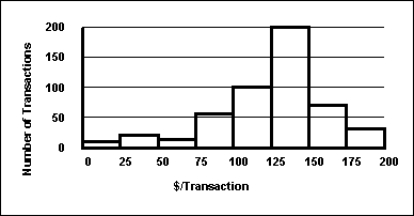 On Friday, the approximate number of sales transactions in the 75-under 100 category was _____________.
A) 10
B) 100
C) 150
D) 200
E) 60
G) A) and E)
Correct Answer

verified
Correct Answer
verified
Multiple Choice
The staff of the accounting and the quality control departments rated their respective supervisor's leadership style as either (1) authoritarian or (2) participatory.Sixty-eight percent of the accounting staff rated their supervisor "authoritarian," and thirty-two percent rated him/her "participatory." Forty percent of the quality control staff rated their supervisor "authoritarian," and sixty percent rated him/her "participatory." The best graphic depiction of these data would be two ___________________.
A) histograms
B) frequency polygons
C) ogives
D) pie charts
E) scatter plots
G) A) and C)
Correct Answer

verified
Correct Answer
verified
Showing 101 - 113 of 113
Related Exams