B) False
Correct Answer

verified
Correct Answer
verified
Multiple Choice
What is the lower class limit in the class -7 to 14
A) -7
B) 3.5
C) 14
D) -7.5
F) A) and C)
Correct Answer

verified
Correct Answer
verified
True/False
The frequency polygon is a graph that displays the data by using lines that connect points plotted for the frequencies at the midpoints of the classes.
B) False
Correct Answer

verified
Correct Answer
verified
Multiple Choice
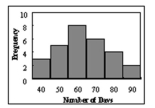
 Find the class with the greatest number of data values.
A) 70
B) 90
C) 60
D) 40
F) A) and D)
Correct Answer

verified
Correct Answer
verified
True/False
The lower class limit represents the smallest data value that can be included in the class.
B) False
Correct Answer

verified
Correct Answer
verified
True/False
A histogram is a graph that represents the cumulative frequencies for the classes in a frequency distribution.
B) False
Correct Answer

verified
Correct Answer
verified
Multiple Choice
What are the boundaries of the class 4-18?
A) 4
B) 14
C) 4 and 18
D) 3.5 and 14.5
F) A) and C)
Correct Answer

verified
Correct Answer
verified
True/False
A frequency polygon and a histogram have the same overall shape.
B) False
Correct Answer

verified
Correct Answer
verified
Multiple Choice
For the numbers -5, -2, -7, and 0, which of the following that includes all four is a good class?
A) -8 to 1
B) -5 to 1
C) -7 to 0
D) -7 to 1
F) All of the above
Correct Answer

verified
Correct Answer
verified
True/False
A stem and leaf plot is useful for keeping more precision than a grouped frequency distribution.
B) False
Correct Answer

verified
Correct Answer
verified
True/False
The cumulative frequency is the sum of the frequencies accumulated to the upper boundary of a class in the distribution.
B) False
Correct Answer

verified
Correct Answer
verified
Multiple Choice
The graphs that have their distributions as proportions instead of raw data as frequencies are called
A) relative frequency graphs.
B) ogive graphs.
C) histograms.
E) All of the above
Correct Answer

verified
Correct Answer
verified
Essay
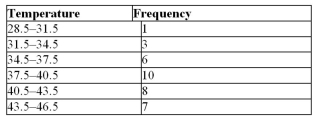
Using the following frequency distribution, construct a frequency
polygon. 
Correct Answer

verified
Correct Answer
verified
Multiple Choice
A pie graph is not useful to show which of the following characteristics of data?
A) The trend of the data over time
B) The relative frequencies of each category of the distribution
C) Which categories make up the larger proportions of the total
D) Which categories make up the smaller proportions of the total
F) A) and C)
Correct Answer

verified
Correct Answer
verified
True/False
The rate of mortality of children is very high in the first weeks of life.It then decreases rapidly until 1 or 2 years of age and then increases slowly into the teen years.In this situation one should construct relative frequency distributions (per year of age) with narrow class widths during the first year of life so as to exhibit the quickly changing mortality rate.
B) False
Correct Answer

verified
Correct Answer
verified
Essay
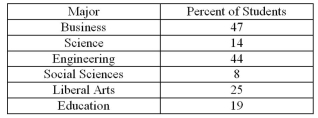
 Construct a pie chart for the following distribution:
Correct Answer

verified
Varies depending on ...View Answer
Show Answer
Correct Answer
verified
View Answer
True/False
An ogive and a frequency polygon have the same overall shape.
B) False
Correct Answer

verified
Correct Answer
verified
Multiple Choice
Which of the following is a histogram?
A) ![]()
B) ![]()
C) ![]()
D) ![]()
F) None of the above
Correct Answer

verified
Correct Answer
verified
Multiple Choice
Which of the following should not be done when constructing a frequency distribution?
A) select the number of classes desired
B) find the range
C) use a class width with an even number
D) use classes that are mutually exclusive
F) B) and D)
Correct Answer

verified
Correct Answer
verified
Essay
 Construct a Pareto chart for the following distribution:
Correct Answer

verified
Sorted in the order ...View Answer
Show Answer
Correct Answer
verified
View Answer
Showing 41 - 60 of 79
Related Exams