A) its resources are not being used efficiently.
B) opportunity costs are decreasing as more of one good is traded for the other good.
C) technology has improved.
D) there is full employment of all resources.
F) A) and C)
Correct Answer

verified
Correct Answer
verified
Multiple Choice
Exhibit 2-7 Production possibilities curve 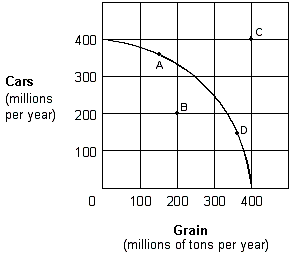 For the economy shown in Exhibit 2-7 to operate at point C, it must:
A) be willing to lower the price of grain.
B) use its given resources more efficiently than it would at point A.
C) experience resource unemployment.
D) experience an increase in its resources and/or an improvement in its technology.
F) B) and D)
Correct Answer

verified
Correct Answer
verified
Multiple Choice
A farmer is deciding whether or not to add fertilizer to his or her crops. If the farmer adds 1 pound of fertilizer per acre, the value of the resulting crops rises from $80 to $100 per acre. According to marginal analysis, the farmer should add fertilizer if it costs less than:
A) $12.50 per pound.
B) $20 per pound.
C) $80 per pound.
D) $100 per pound.
F) B) and C)
Correct Answer

verified
Correct Answer
verified
Multiple Choice
Exhibit 2-18 Production possibilities curves 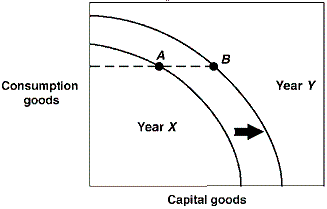 In Exhibit 2-18, a country is located at point A on its Year X production possibilities curve. In Year Y this same country is located at point B on its Year Y production possibilities curve. Which of the following could have brought about this outward shift in production possibilities curves?
A) More efficient production in Year X than in Year Y.
B) A natural disaster in Year X which leads to a destruction of resources.
C) Higher unemployment in Year X.
D) An advance in technology occurred in Year X.
F) B) and D)
Correct Answer

verified
Correct Answer
verified
Multiple Choice
In Europe during the 14th century, the Black Plague killed 24 million people or close to 37 percent of the population. How would this affect the production possibilities curves for the countries of Europe at that time?
A) The production possibilities curves for these countries would have shifted outward.
B) The production possibilities curves for these countries would have shifted inward.
C) The production possibilities curves for these countries would have been unaffected.
D) This would have been illustrated by a movement along the production possibilities curves for these countries, but it would not have shifted them.
F) A) and D)
Correct Answer

verified
Correct Answer
verified
Multiple Choice
Exhibit 2-13 Production possibilities curve 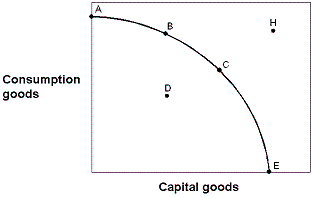 In Exhibit 2-13, point H is:
A) achievable with today's resource base.
B) not achievable today because the economy has not achieved full employment.
C) not achievable today because the economy is not at its maximum point of efficiency.
D) not achievable today because of inadequate production capacity.
F) B) and C)
Correct Answer

verified
Correct Answer
verified
Multiple Choice
An analysis of production possibilities curves indicates that the reason why underdeveloped nations have difficulties increasing their economic growth rates is because:
A) low population growth rates mean fewer workers to produce food and other necessities.
B) their production possibilities curves shift in when resources are increased.
C) the opportunity cost of shifting resources from consumption goods to capital goods is relatively low.
D) they must cut back their already meager consumption levels to increase capital production.
F) All of the above
Correct Answer

verified
Correct Answer
verified
Multiple Choice
If an economy keeps increasing its capital stock, then over time its production possibilities curve will:
A) not move.
B) shift to the left.
C) shift to the right.
D) disappear because scarcity ceases to exist.
F) All of the above
Correct Answer

verified
Correct Answer
verified
Multiple Choice
As production of a good increases, opportunity costs rise because:
A) there will be more inefficiency.
B) people always prefer having more goods.
C) of inflationary pressures.
D) workers are not equally suited to all tasks.
F) B) and C)
Correct Answer

verified
Correct Answer
verified
Multiple Choice
When the opportunity cost of producing carrots increases as more carrots are produced, then:
A) no more carrots will be produced.
B) resources are equally suited to the production of carrots and to other goods.
C) the production possibilities curve is a straight line.
D) the law of increasing opportunity costs is present
F) A) and C)
Correct Answer

verified
Correct Answer
verified
Multiple Choice
Exhibit 2-17 Production possibilities curve 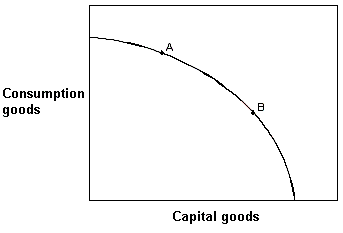 In Exhibit 2-17, if countries A and B currently have the same production possibilities curve (PPC) as given in the figure, but this year country A locates at point A on its PPC and country B locates at point B on its PPC, then country A:
A) is more efficient than country B.
B) will grow at a faster rate than country B.
C) will grow at a slower rate than country B.
D) is producing more capital goods than country B.
F) C) and D)
Correct Answer

verified
Correct Answer
verified
Multiple Choice
The production possibilities curve for the nation of Economania shifts to the right. This could have been caused by:
A) a decrease in Economania's capital stock.
B) technological innovation in the production of Economania goods.
C) high unemployment in Economania the previous time period.
D) Economania producing all consumer goods in the previous period.
F) A) and C)
Correct Answer

verified
Correct Answer
verified
Multiple Choice
Exhibit 2-15 Production possibilities curve 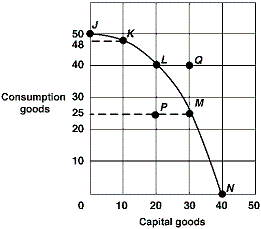 In Exhibit 2-15, the economy will experience the most future economic growth if it chooses what point now?
A) J.
B) K.
C) M.
D) N.
F) None of the above
Correct Answer

verified
Correct Answer
verified
Multiple Choice
A nation can accelerate its economic growth by:
A) reducing the number of immigrants allowed into the country.
B) adding to its stock of capital.
C) printing more money.
D) imposing tariffs and quotas on imported goods.
F) A) and B)
Correct Answer

verified
Correct Answer
verified
Multiple Choice
Exhibit 2-1 Production possibilities curve data In Exhibit 2-1, why is the opportunity cost of producing the fourth unit of capital 4 units of consumption goods but the opportunity cost of producing 4 units of capital is 10 units of consumption goods?
A) It isn't. The opportunity cost of the fourth unit and the opportunity cost of four units is the same.
B) Because consumption goods are more valuable than capital goods.
C) Because the opportunity cost of capital goods is constant while the opportunity cost of consumption goods is decreasing as this economy moves from more consumption goods to more capital goods.
D) Because the opportunity cost of the fourth unit of capital is the consumption goods that must be given up for this economy to move from three units of capital to four units of capital, but the opportunity cots of four units of capital is the amount of consumption goods that must be given up to go from zero units of capital to four units of capital.
F) B) and D)
Correct Answer

verified
Correct Answer
verified
Multiple Choice
Adding more resources causes:
A) downward movement along a production possibilities curve.
B) the production possibilities curve to shift in.
C) upward movement along a production possibilities curve.
D) the production possibilities curve to shift out.
F) A) and D)
Correct Answer

verified
Correct Answer
verified
Multiple Choice
According to marginal analysis, you should choose to do something if the extra benefit:
A) is positive.
B) outweighs the extra cost.
C) exceeds the benefits of the previous time spent on the activity.
D) will change the outcome.
F) B) and C)
Correct Answer

verified
Correct Answer
verified
Multiple Choice
The production possibilities curve for the nation of Economagic shifts to the left. This could have been caused by:
A) an increase in Economagic's labor supply.
B) innovation in the production of goods in Economagic.
C) a war that destroyed some of Economagic's resource base.
D) unemployment among Economagic's workers.
F) B) and C)
Correct Answer

verified
Correct Answer
verified
Multiple Choice
Technological innovations will cause:
A) the production possibilities curve to stay the same.
B) the production possibilities curve to shift to the left.
C) the production possibilities curve to shift to the right.
D) an economy to operate below its production possibilities curve.
F) A) and D)
Correct Answer

verified
Correct Answer
verified
Multiple Choice
Exhibit 2-4 Production possibilities curve data In Exhibit 2-4, choose the best production alternative if the only goal of the economy is investment.
A) A
B) C
C) E
D) All production alternatives represent the same level of investment because all are efficient.
F) All of the above
Correct Answer

verified
Correct Answer
verified
Showing 21 - 40 of 107
Related Exams