A) A decrease in birth rate with increasing population size is a density-independent factor.
B) An increase in emigration rate with increasing population size is a density-dependent factor.
C) Only density-independent factors can regulate population size.
D) Density-independent factors do not have large effects on population size.
F) A) and C)
Correct Answer

verified
Correct Answer
verified
Multiple Choice
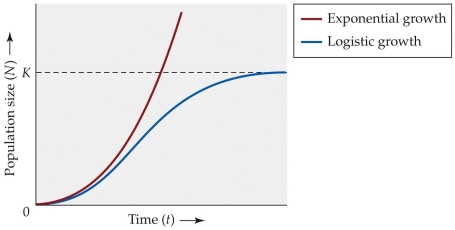
Refer to the figure.
 Use the figure to determine the point at which the population growth rate is maximized under the logistic model.
A) The rate is maximized when N = K/2.
B) The rate is maximized when the population is extremely small.
C) The rate is maximized when K is reached.
D) The rate is maximized when K is surpassed.
F) A) and D)
Correct Answer

verified
Correct Answer
verified
Multiple Choice
A population of prickly pear cacti has 1,500 individuals with an intrinsic rate of increase (r) of 0.3. As the population gets close to its carrying capacity of 2,000 individuals, how will r change?
A) r will be near 0.
B) r will be less than zero.
C) r will be slightly less than 0.3.
D) r will be slightly more than 0.3.
F) A) and C)
Correct Answer

verified
A
Correct Answer
verified
Short Answer
Species A is a nonreproductive age shrub you have been studying for 3 years after a wildfire destroyed all the vegetation on your field site. In year 0, 340 individuals were tagged. In year 1, 288 individuals were still alive. In year 2, 250 individuals were alive. In year 3, 200 individuals remained. Based on this data, calculate: (a) The survivorship (lx) for year 1 (b) The survivorship (lx) for year 3.
Correct Answer

verified
Correct Answer
verified
Multiple Choice
Which statement about density-independent factors is true?
A) Davidson and Andrewartha's studies of thrips (Thrips imaginis) showed that density-independent factors play a major role in the annual fluctuations of abundance of this species.
B) Density-independent factors increase the size of populations when population size is low.
C) Density-independent factors decrease the size of populations when population size is high.
D) Food and habitat availability are density-independent factors that influence population size.
F) B) and D)
Correct Answer

verified
A
Correct Answer
verified
Multiple Choice
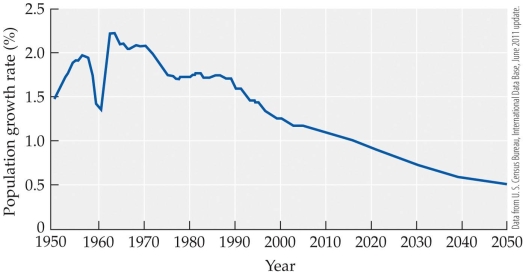
Refer to the figure.
 Based on the figure, what year is the world population growth rates expected to be only 1%?
A) 1960
B) 2000
C) 2020
D) never
F) B) and D)
Correct Answer

verified
Correct Answer
verified
Multiple Choice
Refer to the figure.
 The birth and death rates of a population of garter snakes were monitored over 11 years, during which time population density varied considerably. According to the figure, which statement about the populations is true?
A) Density-independent factors are regulating population size.
B) At high population sizes, the death rate is higher than it is at low population sizes.
C) Birth rate declines at high population sizes.
D) Birth rates equal death rates.
F) A) and D)
Correct Answer

verified
Correct Answer
verified
Multiple Choice
The maximum population size that can be supported indefinitely by the environment is
A) carrying capacity.
B) ecological footprint.
C) logistic growth curve.
D) survivorship curve.
F) None of the above
Correct Answer

verified
Correct Answer
verified
Multiple Choice
Davidson and Andrewartha's studies of thrips (Thrips imaginis) showed that
A) annual fluctuations in population size could be predicted based on rainfall and temperature data.
B) annual fluctuations in population size were due primarily to density-dependent factors.
C) density-independent factors increase the size of populations when population size is low.
D) a fluctuation in weather altered birth rates but did not alter death rates.
F) A) and C)
Correct Answer

verified
Correct Answer
verified
Multiple Choice
A population of Drosophila mauritiana reproduces in synchrony at discrete time periods every generation, and generations occur at two-week intervals. The current population size is 1,000, and its geometric population growth rate is 3.0 per generation. What will the expected size of the population be after six weeks?
A) 3,000
B) 9,000
C) 27,000
D) 81,000
F) A) and B)
Correct Answer

verified
Correct Answer
verified
Multiple Choice
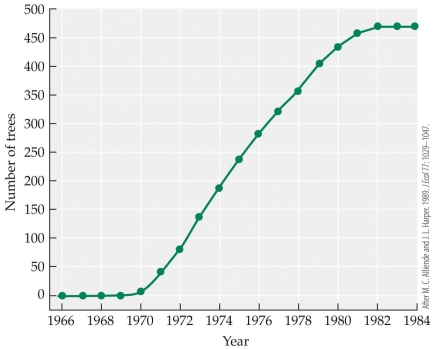
Refer to the figure.
 Based on the figure, how long did it take willows to reach their carrying capacity in Australia?
A) It never reached carrying capacity.
B) 12 months
C) 1.2 years
D) 12 years
F) B) and D)
Correct Answer

verified
Correct Answer
verified
Multiple Choice
Which statement about logistic growth is false?
A) The carrying capacity is the maximum population size that can be supported by the environment for one year.
B) At low densities, logistic growth is similar to exponential growth.
C) At the carrying capacity, there is no population growth in the logistic model.
D) Logistic growth of a population can be represented by an S-shaped curve.
F) A) and C)
Correct Answer

verified
A
Correct Answer
verified
Multiple Choice
In comparing exponential and geometric growth, which statement is true?
A) Lambda (?) can be calculated from r and is equivalent to the natural logarithm of r.
B) Lambda (?) can be calculated from r and is equivalent to "e" raised to the r power.
C) The multiplier r can be calculated from , and is equivalent to "e" raised to the power.
D) The multiplier r is not used in estimating exponential or geometric growth.
F) B) and D)
Correct Answer

verified
Correct Answer
verified
Multiple Choice
A fictional animal, the tribble, reproduces in synchrony at regular intervals. When the logarithm of a particular tribble population was plotted against time, the result was a straight and increasing line. Which statement about the tribble population is false?
A) The tribble population is increasing in size geometrically.
B) The of the tribble population is constant and greater than 1.
C) If the actual population size were plotted against time, the result would be an increasing J-shaped curve.
D) r = 0.
F) C) and D)
Correct Answer

verified
Correct Answer
verified
Multiple Choice
Mountain gorillas put a lot of effort in raising their young, ensuring they are protected and well cared for. In a natural population in the absence of poaching, and a lack of habitat destruction and other manmade dangers, the mountain gorilla would represent which type of survivorship curve?
A) Type I
B) Type II
C) Type III
D) Type IV
F) B) and C)
Correct Answer

verified
Correct Answer
verified
Multiple Choice
Which type of survivorship curve is seen most frequently in the wild?
A) Type I (most individuals survive to old age)
B) Type II (constant rate of mortality throughout lifetime)
C) Type III (most individuals die young)
D) Type I and Type II are about equally common.
F) C) and D)
Correct Answer

verified
Correct Answer
verified
Multiple Choice
Which population is likely to be increasing in size?
A) A population with an r of -0.04
B) A population with a of 1.3
C) A population with a of 0.98
D) A population with a of 0
F) A) and B)
Correct Answer

verified
Correct Answer
verified
Multiple Choice
The logistic equation assumes that
A) the per capita growth rate is a constant.
B) the per capita growth rate declines with increasing density.
C) populations will increase in size indefinitely.
D) r increases in a straight line as density increases.
F) B) and C)
Correct Answer

verified
Correct Answer
verified
Multiple Choice
A continuously growing population of alligators has a population size of 1,000 and an intrinsic rate of increase of r = 0.05 per year. Assuming that this rate of increase remains the same, about how long should it take for the population to grow larger than 4,000 individuals? (Note: The natural logarithm of 2 is about 0.70.)
A) Less than 4 years
B) A little more than 7 years
C) About 14 years
D) A little more than 27 years
F) None of the above
Correct Answer

verified
Correct Answer
verified
Multiple Choice
Which of the following would not be an example of density-dependent factors regulating population size?
A) The number of possible territories for robins is limited; thus when population sizes are high, a lower proportion of individuals can produce offspring.
B) In conditions of overcrowding, some desert pupfish living in ponds will emigrate to other ponds if given the opportunity.
C) Predation on mosquitofish is high, regardless of population size.
D) In conditions of high density, mice are more susceptible to mortality from heat stress.
F) A) and C)
Correct Answer

verified
Correct Answer
verified
Showing 1 - 20 of 69
Related Exams