A) 8%
B) 16%
C) 32%
D) 68%
E) 84%
G) All of the above
Correct Answer

verified
Correct Answer
verified
Multiple Choice
Studies have shown that 5%-10% of all breast cancers are related to mutations in BRCA1 and BRCA2. A logical conclusion from these data is that:
A) most women with breast cancer have mutations in one or both of these genes.
B) most women with breast cancer must have inherited the gene from their mother.
C) at least some breast cancers are caused by the environment or by genes other than BRCA1 and BRCA2.
D) not all mutations in BRCA1 and BRCA2 have been identified to account for the other 90%-95% of breast cancers.
F) A) and B)
Correct Answer

verified
Correct Answer
verified
Multiple Choice
Consider a trait determined by a rare, simple Mendelian, autosomal recessive allele. What is the concordance between identical twins? Between same-sex fraternal twins?
A) identical concordance = 1; fraternal concordance = 0.071
B) identical concordance = 1; fraternal concordance = 0.143
C) identical concordance = 1; fraternal concordance = 0.250
D) identical concordance = 1; fraternal concordance = 0.333
E) identical concordance = 1; fraternal concordance = 0.500
G) A) and B)
Correct Answer

verified
Correct Answer
verified
True/False
Red coloration in wheat seeds is a complex trait influenced by three unlinked genes, each with two different alleles A and a; B and b; C and c. This Punnett square shows the results of a mating between two plants that are both heterozygous at all three loci. 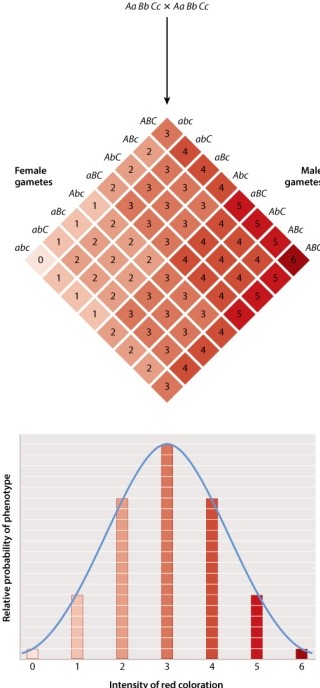 The intensity of the red color phenotype is influenced by only one of the gene products.
B) False
Correct Answer

verified
Correct Answer
verified
Multiple Choice
Which of the traits depicted here has the SMALLEST heritability? 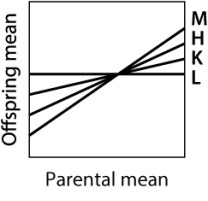
A) trait M
B) trait H
C) trait K
D) trait L
F) A) and C)
Correct Answer

verified
Correct Answer
verified
Multiple Choice
The plots shown here depict several possible outcomes of an experiment comparing the mean phenotype of a behavioral trait in two strains of mice in three environments. Strain 1 is represented by filled circles and Strain 2 is represented by open circles. Environment 1 (E1) is deficient in stimulation for the behavior, environment 2 (E2) has an average level of stimulation, and environment 3 (E3) is enriched in stimulation. Which of the possible results indicates the absence of genotype-by-environment interaction? 
A) result M
B) result H
C) result K
D) result L
E) None of the answer options is correct.
G) A) and E)
Correct Answer

verified
Correct Answer
verified
Multiple Choice
Diets high in fat and carbohydrates affect inbred lines of mice differently. One line becomes obese and the other does not. This is called a _____ interaction.
A) genotype-by-environment
B) phenotype-by-environment
C) genotype-by-phenotype
D) genotype-by-trait
E) phenotype-by-genotype
G) A) and E)
Correct Answer

verified
Correct Answer
verified
Multiple Choice
Salt intake is associated with an increased likelihood of high blood pressure and is therefore a(n) _____ of this common disorder.
A) environmental risk factor
B) genetic risk factor
C) complex trait
D) simple trait
E) associative risk factor
G) B) and C)
Correct Answer

verified
Correct Answer
verified
Multiple Choice
Which of the following traits would you expect to conform to a normal distribution?
A) hypertension (high blood pressure)
B) type II diabetes
C) Alzheimer's disease
D) albinism
E) sickle-cell anemia
G) A) and C)
Correct Answer

verified
Correct Answer
verified
Multiple Choice
If the concordance rate for a given trait is 10% for both identical and fraternal twins, this means that:
A) genes play a major role in the development of this trait, and the effect of environment in the appearance of this trait is negligible.
B) genes play a (relatively) minor role in the development of this trait, whereas environment plays a major role in the appearance of this trait.
C) genes and environment contribute equally to the development of this trait.
D) based on this data, you can make no statements regarding the role of either genes or environment in the manifestation of this trait.
F) A) and B)
Correct Answer

verified
Correct Answer
verified
True/False
Personalized medicine matches the treatment to the disease, not to the patient.
B) False
Correct Answer

verified
Correct Answer
verified
Multiple Choice
In which of the complex traits shown here is variation determined almost completely by heredity? 
A) trait M
B) trait H
C) trait K
D) trait L
E) trait Q
G) A) and B)
Correct Answer

verified
Correct Answer
verified
Multiple Choice
Personalized medicine matches the treatment to the:
A) insurance.
B) hospital.
C) disease.
D) phenotype.
E) genotype.
G) A) and C)
Correct Answer

verified
Correct Answer
verified
Multiple Choice
The scatterplots below show the relation between the average phenotype of parents (x-axis) and that of their offspring (y-axis) for three traits. One trait has a heritability of 90% (comparable to that of fingerprint ridge count) , another has a heritability of 50% (comparable to that of human height) , and yet another has a heritability of 25% (comparable to that of human longevity) . To make the axes comparable, for each trait the phenotypic measurement is expressed as a deviation from the overall mean in multiples of the standard deviation.
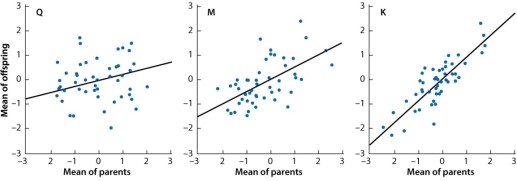 The fact that all of the lines slope upward means that:
A) variation in each trait is affected by differences in heredity.
B) variation in each trait is affected by environmental differences.
C) the genes affecting any one trait have no effect on any other trait.
D) some genes affect all three traits.
E) the traits all show genotype-by-environment interaction.
G) B) and E)
Correct Answer

verified
Correct Answer
verified
Multiple Choice
The scatterplots show the relation between the average phenotype of parents (x-axis) and that of their offspring (y-axis) for two traits in a variety of tropical sweet corn. One trait is ear height, which has a heritability of 75%; and the other is ear length, which has a heritability of 25%. To make the axes comparable, for each trait the phenotypic measurement is expressed as a deviation from the overall mean in multiples of the standard deviation. Which of the following matchups is CORRECT? 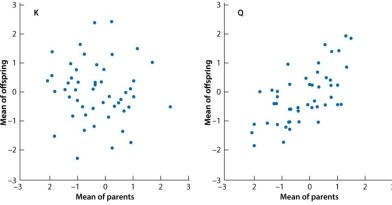
A) Ear length is trait K and ear height is trait Q.
B) Ear length is trait Q and ear height is trait K.
C) Ear length and ear height are both trait K.
D) Ear length and ear height are both trait Q.
F) B) and D)
Correct Answer

verified
Correct Answer
verified
Multiple Choice
Which of the traits depicted here illustrates regression toward the mean? 
A) trait M
B) trait H
C) trait K
D) trait L
E) trait Q
G) A) and E)
Correct Answer

verified
Correct Answer
verified
Multiple Choice
Which of the following are complex traits?
A) type II diabetes
B) red-green color blindness
C) hemophilia
D) obesity
E) sickle-cell anemia
G) C) and D)
Correct Answer

verified
Correct Answer
verified
Multiple Choice
Lindsay and Joy are twins that share the same genetic material and appear so similar that their teachers cannot tell them apart. Lindsay and Joy are _____ twins.
A) identical
B) fraternal
C) dizygotic
D) monozygotic
E) identical and monozygotic.
G) C) and D)
Correct Answer

verified
Correct Answer
verified
Multiple Choice
When differences in the phenotype due to the environment can be ignored:
A) the environmental component of a complex trait can be more easily identified.
B) the genetic variation underlying phenotypic differences can be more easily identified.
C) the trait is not considered a complex trait.
D) epistatic interactions determine phenotypes.
E) All of these choices are correct.
G) B) and D)
Correct Answer

verified
Correct Answer
verified
Multiple Choice
Which of the graphs below would likely represent the distribution of a simple, single gene trait? 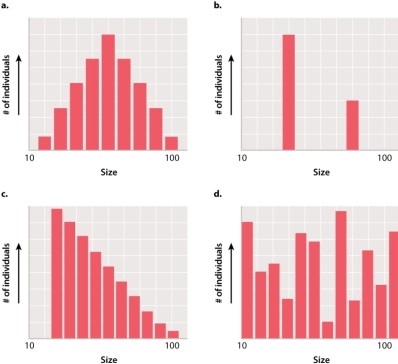
A) graph A
B) graph B
C) graph C
D) graph D
F) C) and D)
Correct Answer

verified
Correct Answer
verified
Showing 41 - 60 of 164
Related Exams